Percolation Visualizer
Your completed PercolationVisualizer should prompt the user for N and display the
percolation process starting with a N-by-N grid of sites (initially all
blocked and
black). After
each site is opened, display full sites in
cyan,
open sites (that aren’t full) in
white,
and blocked sites in black using
princeton.StdDraw.
Here is an example of steps in a visualization on a 20x20 grid as in this linked movie and the following snapshots.
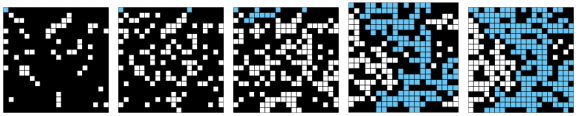
#####Going from 50 to 100 to 150 to 204 to 250 open sites in a 20x20 grid.
You can test your code by adding a method in your PercolationVisualizer to read cells to open from a file. The first line is N and the subsequent lines are cells to open. Opening the cells in input20.txt should result in the animation shown in the movie above. You could add either add a method to PercolationVisualizer to read in the cells to open from a file. Alternatively, you could read the row and column indices from the two arrays defined below.
rowIndices = { 6, 17, 11,  8,  4,  0, 11,  4, 15,  2,  8, 11,  3,  2,  1,
4,  4, 16,  9,  3, 12,  3,  2,  7, 12, 14, 18, 18,  4, 18,  8,  6,  6,  8,
2,  1,  3,  9,  8,  9, 12,  8,  5,  7,  5, 13,  4,  3, 11, 17,  4, 14, 16,
3, 10, 10, 17,  7,  4,  1, 13, 12, 10, 10, 10, 12, 14,  5, 17, 13,  2,  7,
11,  5, 13, 10,  8, 14, 18, 14,  5,  7,  8,  9, 13, 13,  0, 10, 18, 17, 12,
17,  1,  4,  3,  3, 13,  1, 14, 19, 11,  7,  4, 17,  4,  9,  1,  4,  2, 19,
10, 15,  3,  8, 16, 13, 18,  6, 18, 10, 14, 12, 13, 10, 11, 16, 11,  0,  3,
17, 16, 12,  6,  1,  7, 18, 11, 19,  3, 14, 14, 16, 16,  0,  4, 19, 17,  2,
13, 15, 16, 18,  9,  0,  1, 14,  5, 11, 14, 17,  0, 15, 15, 18,  0,  7,  0,
18,  7, 15,  3, 14, 10,  3,  0,  3,  7, 13, 18, 17,  4, 16,  3,  6, 12,  1,
10, 15, 17, 10, 14, 14, 16, 15, 17, 17,  2,  6,  9, 13, 16,  0, 17,  6, 15,
5, 10, 11, 11,  6,  1, 12,  0, 14, 12, 16, 12, 14,  7, 18,  4,  0, 13,  5,
11,  6, 19,  8,  2, 15, 19,  6, 19,  6,  8,  7,  2,  2,  2,  4, 18, 15, 19,
4,  5,  7, 11,  1, 15,  0, 15,  0};
colIndices = { 10, 10,  4,  4,  8,  0,  0,  3, 18, 12, 13,  3, 10,  2,  1,
16, 19, 10,  2, 16,  3, 17,  3, 14,  4,  6, 19, 17,  0, 10,  9, 14,  0, 12,
11, 12,  9, 10,  0, 16, 14,  5,  4, 16,  8,  5,  9, 11, 15,  1, 10, 15, 12,
14,  2, 12, 19, 11,  5,  5, 17, 13,  6, 19, 13,  9, 16, 14,  9, 10,  0,  9,
13, 13,  9,  8, 18,  1,  5, 12,  1,  6,  8,  6, 19,  7, 13, 14,  0,  7,  7,
11,  4,  1,  6, 19, 12,  7, 11, 11,  6, 13,  4, 15, 11, 14,  6, 18,  8, 12,
7, 17,  4, 14,  9, 18,  7, 12, 11, 11, 17, 17,  0, 18, 18,  3,  5,  8,  8,
8, 18, 19,  1,  3, 10,  6,  1,  5, 15,  4,  2,  5, 11,  4, 13,  6,  6, 18,
14, 16, 14, 18,  5,  7,  8, 10,  6, 17,  3, 16, 10, 19,  3,  8,  6,  1, 12,
12,  2,  2,  1,  8,  3,  0, 14,  7, 12, 11, 13, 14,  6, 13,  5,  8,  6, 14,
0, 10,  4,  1, 14,  7,  6,  7,  0,  2, 17,  7, 13, 13, 15,  3, 12,  9,  1,
7,  5,  8, 10,  5,  2,  0,  1,  0, 15, 19, 18, 18,  0,  9, 12, 16,  4,  9,
11, 15, 18, 10,  5,  0,  0, 17,  4, 11,  1, 19, 14, 13,  4, 17, 16, 11,  3,
15,  2,  5, 14, 15,  5, 17,  5, 17};
When drawing the grid, the animation will be smoothest if you do not call StdDraw.show more than once per iteration. Otherwise, some cells may flash white before appearing blue if your IPercolate implementation allows for a cell to be open and full at the same time.